
Executive Summary
Motorcyclists who ride in both Latin America and the United States often notice an apparent contradiction. Roads that look the most disorderly — narrow lanes, mixed traffic, unpredictable pedestrians, uneven pavement — do not necessarily produce the most severe crashes. Roads that look the safest — wide, smooth, well-marked American arterials and freeways — often do.
This paper examines that apparent paradox using Guatemala and the United States as a case study. It is not an argument that Guatemala’s roads are objectively safer than America’s; national fatality data make clear that they are not. Instead, the paper argues a narrower and more defensible point: the visual complexity of a roadway environment is a poor predictor of crash severity, because severity is governed primarily by impact speed and the kinetic energy a body must absorb in a collision. Chaotic-looking environments frequently suppress operating speed. Forgiving, well-engineered environments frequently permit it — and speed, not scenery, is what determines how survivable a crash will be.
The discussion draws on U.S. federal crash data, World Health Organization and Pan American Health Organization road-safety statistics, a 2024 clinical study of motorcycle trauma in Petén, Guatemala, and the risk-compensation literature (Wilde, Adams, and Nilsson) that explains why road users adjust their behavior to match their perception of risk. Together, these sources support a conclusion relevant to riders, safety professionals, and accident reconstructionists alike: how dangerous a road looks and how much energy is released when something goes wrong are two different questions.
1. The Guatemala Paradox
There is absolutely no way this works — that is usually the first reaction of a rider from the United States seeing Guatemalan traffic for the first time.
Motorcycles thread between buses, potholes, pedestrians, dirt shoulders, livestock, and river crossings, often carrying a passenger and cargo at once, with inches of clearance and no apparent regard for lane discipline. To an outside observer, it looks like a continuous near-miss.
Spend enough time riding in both systems, however, and a different pattern emerges: the roads that look the most chaotic are frequently not the ones producing the most severe crashes. The reason is not that the environment is safe. It is that the environment is slow. Congestion, narrow lanes, rough pavement, mixed traffic, and constant hazard negotiation impose a natural speed ceiling. Riders in these conditions are typically moving in the range of 15–35 mph, continuously managing traction and closing distance, rather than traveling at 60–85 mph on a freeway among distracted drivers.
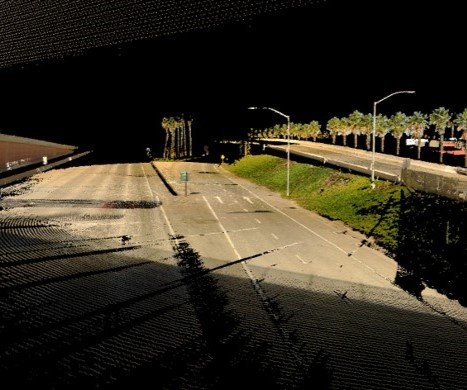
American roads, by contrast, often feel safer precisely because they are engineered to feel that way: wide lanes, smooth pavement, clear sightlines, and predictable geometry. That same engineering is what permits — and often implicitly invites — much higher operating speeds. A rider can spend years in that environment without ever having to manage a real traction change or a close-quarters hazard, until a single high-speed event becomes unsurvivable.
2. What the Data Show
United States
U.S. federal crash data illustrate how disproportionately motorcyclists are represented in fatal outcomes. In 2023, 6,335 motorcyclists were killed in traffic crashes — about 15 percent of all U.S. traffic deaths — even though motorcycles accounted for only about 3.3 percent of registered vehicles and 0.6 percent of vehicle miles traveled nationally. Measured per mile traveled, the motorcyclist fatality rate in 2023 was 31.39 deaths per 100 million vehicle miles, versus 1.13 for passenger car occupants — nearly 28 times higher.
Those figures describe a road system that is, in absolute terms, engineered to a high standard: divided highways, consistent signage, controlled intersections, and comparatively disciplined traffic flow. The lethality is concentrated less in the chaos of the environment than in the speed and energy involved when a crash does occur.
Guatemala
Guatemala’s road safety picture is, by contrast, poor on an aggregate, population-level basis. The World Health Organization’s 2023 Global Status Report on Road Safety placed Guatemala’s road-traffic mortality rate at roughly 12.5 deaths per 100,000 inhabitants — among the highest in the Americas — driven by weak enforcement, inconsistent helmet use, limited emergency medical infrastructure, and a large and growing motorcycle fleet.
A 2024 clinical study conducted at the regional trauma hospital in Petén, Guatemala, documented just how unsafe everyday riding practices are: of 100 motorcycle riders observed on the street, only three wore helmets, riders averaged more than two and a half occupants per motorcycle, and children were present on the majority of motorcycles observed. Motorcycle-related trauma made up a large share of blunt-trauma admissions at the hospital, with head injury disproportionately represented.
These numbers matter, and they should not be minimized. They reflect a real and serious public-health problem — one rooted primarily in helmet use, occupant loading, licensing, and post-crash care rather than in vehicle speed alone.
Reconciling the Two Pictures
The apparent contradiction resolves once frequency and severity are separated. Guatemala’s high aggregate fatality rate is driven substantially by exposure factors: minimal helmet use, severe overloading of motorcycles, limited trauma care, and a very high proportion of trips made by motorcycle rather than car. None of that contradicts the observation that any single low-speed crash on a congested, self-regulating road tends to release far less kinetic energy than a single high-speed crash on an open American arterial. Both things are true at once: Guatemala’s system is, in aggregate, more dangerous to be part of, while many individual Guatemalan crashes are, in physical terms, lower-energy events than their American counterparts. It is this second, narrower point — the relationship between roadway appearance, operating speed, and crash energy — that is the actual subject of this paper.
3. The Physics of Crash Severity
Crash severity is governed primarily by kinetic energy, which increases with the square of velocity:
KE = ½ m v²
A modest increase in speed produces a disproportionately large increase in the energy that must be dissipated in a collision — through deformation of the vehicle, the road surface, protective equipment, and, ultimately, the human body. Doubling speed does not double crash energy; it roughly quadruples it. The table below illustrates the relative kinetic energy of a given mass at several representative speeds, indexed to 30 mph.
| Impact Speed | Relative Kinetic Energy (vs. 30 mph) |
| 20 mph | 0.44× |
| 30 mph | 1.00× |
| 40 mph | 1.78× |
| 50 mph | 2.78× |
| 60 mph | 4.00× |
| 70 mph | 5.44× |
| 85 mph | 8.03× |
Relative kinetic energy at representative operating speeds, indexed to 30 mph (KE ∝ v²).
At 20 mph — typical of a congested Guatemalan secondary road — crash energy is well under half of the 30 mph baseline. At 60 mph, a common U.S. arterial or rural highway speed, energy is four times higher. At 85 mph, representative of higher-speed freeway travel, energy is roughly eight times higher. Braking distance grows in the same nonlinear way, compounding the effect: a vehicle traveling at 60 mph requires far more than twice the stopping distance of one traveling at 30 mph, leaving less margin to avoid a collision altogether, and more energy to manage if a collision cannot be avoided.
This relationship is central to accident reconstruction and is well established in the engineering literature. It is also, critically, independent of how orderly or chaotic the surrounding traffic environment looks. A crash’s energy budget is set by mass and velocity, not by the visual complexity of the road on which it occurs.
4. Risk Compensation and Human Factors
If crash energy is a function of speed, the next question is what determines the speed riders actually choose. The behavioral literature on risk compensation offers a well-supported answer: road users continuously and often unconsciously adjust their behavior to match their perceived level of risk, rather than to some fixed, objective standard of caution.
Wilde’s Risk Homeostasis Theory
Psychologist Gerald Wilde proposed that individuals hold an internal, self-selected “target level” of acceptable risk, and that they adjust their behavior — speed, following distance, attentiveness — to keep actual risk near that target, even as external conditions change. Under this theory, when a safety improvement reduces perceived risk (a wider lane, a smoother surface, better visibility), riders tend to compensate by taking more risk elsewhere, most commonly by increasing speed, which can offset some or all of the intended safety benefit.
Adams’s Risk Compensation
British risk analyst John Adams extended this idea, arguing that road users act as intuitive risk managers who respond to the perceived, not the actual, level of danger in their environment. Adams observed that engineering interventions intended to make roads objectively safer can sometimes fail to reduce — or can even increase — crash severity, because they change perceived risk and therefore change behavior, particularly operating speed.
Nilsson’s Power Model
Swedish researcher Göran Nilsson’s Power Model provides the quantitative link between speed and outcome: it models crash frequency and severity as increasing with mean traffic speed raised to a power, such that fatal-crash risk rises considerably faster than speed itself. The Power Model is widely used by transportation agencies to estimate how speed-limit and design changes will affect fatality counts, and it is consistent with the underlying physics of kinetic energy described in Section 3.
Applied to this paper’s subject: a Guatemalan secondary road that looks hazardous keeps perceived risk high, which suppresses speed and, by the Power Model’s logic, suppresses crash severity as well. A U.S. arterial engineered to look and feel safe lowers perceived risk, which — consistent with Wilde’s and Adams’s frameworks — permits higher operating speed, and, again by the Power Model, higher-severity outcomes when a crash occurs. None of these theories are offered here as strictly proven laws; they are well-developed, widely cited frameworks with substantial empirical support, and they are treated as such rather than as settled fact.
5. Implications for Accident Reconstruction
For reconstructionists, attorneys, and insurers, the practical takeaway is that roadway appearance is not a reliable proxy for crash severity, and should not be treated as one when evaluating a case. A chaotic-looking environment does not, by itself, establish that a crash occurred at high energy, and a well-engineered, forgiving roadway does not, by itself, establish that a crash occurred at low energy. The variables that actually determine severity — pre-impact speed, perception-response time, sight distance, roadway friction, braking capability, and impact geometry — must be measured and modeled directly rather than inferred from how orderly or disorderly the surrounding traffic looked.
This has a second, related implication for engineering and policy: safety interventions that primarily reduce perceived risk, without also constraining achievable speed, risk trading crash frequency for crash severity. A resurfaced, widened, well-signed roadway may produce fewer crashes overall while producing more severe outcomes in the crashes that still occur — an outcome the risk-compensation literature would predict and one worth testing empirically on any given corridor rather than assuming away.
6. Conclusions
Guatemala is not a safer place to ride a motorcycle than the United States, and the aggregate data — driven by helmet use, occupant loading, and trauma-care capacity — make that clear. But the instinctive sense that a chaotic-looking road is automatically the more dangerous one, in terms of crash energy, does not hold up under examination. Crash severity is governed by kinetic energy, kinetic energy is governed by speed, and speed is governed less by how a road is engineered than by how safe that engineering makes a rider feel.
The practical lesson, for riders and reconstructionists alike, is to separate two questions that are easy to conflate: how likely is a crash, and how severe will it be if one happens. Visual disorder tends to suppress the first by demanding constant attention, and, in doing so, often suppresses the second as well by keeping speeds low. Visual order and engineering polish tend to do the opposite. Recognizing that distinction — and measuring speed and energy directly, rather than inferring them from how a road looks — is essential to sound accident reconstruction and to a more complete understanding of what actually makes riding dangerous.
References
Adams, J. (1995). Risk. UCL Press.
Insurance Institute for Highway Safety. (2026). Fatality Facts 2024: Motorcycles and ATVs. IIHS-HLDI. https://www.iihs.org/research-areas/fatality-statistics/detail/motorcycles-and-atvs
National Highway Traffic Safety Administration. (2025). Motorcycles: 2023 Data (Traffic Safety Facts, DOT HS 813 732). U.S. Department of Transportation.
National Highway Traffic Safety Administration. (2026). Motorcycle Safety: Helmets, Motorists, Road Awareness. U.S. Department of Transportation. https://www.nhtsa.gov/road-safety/motorcycles
Nilsson, G. (2004). Traffic Safety Dimensions and the Power Model to Describe the Effect of Speed on Safety. Lund Institute of Technology.
Pan American Health Organization. (2023). Saving Lives: A Safe Systems Approach to Road Safety in the Americas. PAHO. https://www.paho.org
Flores, M., et al. (2024). Unsafe Practices of Motorcycle Riders in El Petén, Guatemala: A Community Observational Study and a Retrospective Institutional Review. Journal of Surgical Research. https://pubmed.ncbi.nlm.nih.gov/38917573/
United Nations. (2024). What if We Could Put an End to Loss of Precious Lives on the Roads? UN Chronicle. https://www.un.org/en/un-chronicle/what-if-we-could-put-end-loss-precious-lives-roads
Wilde, G. J. S. (1994). Target Risk: Dealing with the Danger of Death, Disease and Damage in Everyday Decisions. PDE Publications.
World Health Organization. (2023). Global Status Report on Road Safety 2023 — Guatemala Country Profile. WHO. https://www.who.int/publications/m/item/road-safety-gtm-2023-country-profile